
Live Chat Metrics: The Complete Guide to Live Chat Performance, Agent Excellence & Business Growth
Discover the most important live chat metrics to track performance, improve agent productivity, enhance customer experience, and drive measurable business growth.
Picture this: it’s a peak traffic day — a product launch, a holiday sale, a sudden viral mention. Your live chat queue is a war zone. Customers are waiting. Agents are drowning. And somewhere in the chaos, your support operation is running on gut feel instead of data.
Sound familiar?
Here’s what separates the support leaders who consistently hit great satisfaction scores from those who are perpetually firefighting: they know their numbers. Not just the vanity metrics. The right ones.
Live chat metrics aren’t pretty graphs you glance at before a board meeting. They are the real-time pulse of your customer experience — the difference between a support operation that scales confidently and one that collapses under its own weight. And yet, most support teams barely scratch the surface of what their data is actually telling them.
This guide is your deep dive. We’re covering what live chat performance metrics really are, which ones to obsess over (and which to ignore), how to measure response and resolution times with precision, how to evaluate your agents fairly, and — most importantly — how to translate all of this data into better customer satisfaction and genuine business growth.
Whether you’re a support manager asking “what are live chat performance metrics and where do I even start?” or an experienced CX leader looking to sharpen a mature operation, you’ll leave this guide with clarity, a practical framework, and zero confusion.
Let’s get into it.
|
What Are Live Chat Performance Metrics — And Why Most Teams Get Them Wrong
Before we dive into the full list, let’s get the definition right — because most explanations flatten something genuinely complex into a bullet point.
The Real Definition (Not the Textbook One)
The textbook answer: live chat performance metrics are quantitative measurements used to evaluate the effectiveness, efficiency, and quality of your live chat support operations.
The real answer: they’re the story your support operation tells about itself — whether it’s one of speed and satisfaction, or one of burnout and missed revenue.
Think of your live chat like a finely tuned clock. Every gear — agent response speed, first contact resolution, customer satisfaction — must mesh together for the whole machine to work. Measuring metrics for live chat means understanding how each gear turns, and what happens when one starts slipping.
Why Most Teams Get This Wrong
Most support leaders fall into one of two traps. They either track too many metrics and drown in dashboards that never drive action — or they track the wrong ones entirely, optimising for agent convenience instead of customer experience.
|
Why Live Chat Metrics Are Non-Negotiable in 2026
Here’s the landscape you’re operating in right now:
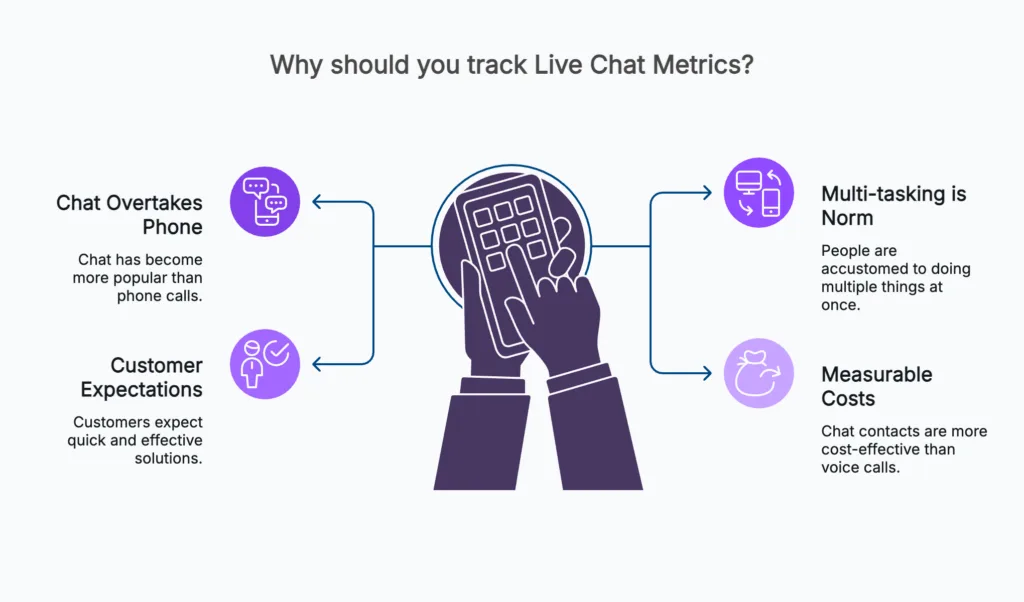
- Chat has overtaken phone as the preferred support channel for Millennials and Gen Z. According to HubSpot’s State of Service Report, live chat has the highest satisfaction level of any customer service channel — 73% of customers are satisfied with chat interactions.
- Multi-tasking is now the norm. Agents handle 2–4 simultaneous conversations. Without visibility into occupancy and concurrency metrics, burnout and quality degradation are inevitable.
- Customers expect speed and resolution. Salesforce’s State of Service Report found 88% of customers say the experience a company provides is as important as its products and services.
- Costs are real and measurable. Chat contacts cost around $11.20 per chat on average vs. $15–$25 for voice (MetricNet benchmarking data). Monitoring the right metrics protects that advantage.
|
Live chat isn’t just a widget on your website. It’s a revenue lever, a retention driver, and a cost centre — all at once. And levers only work when you understand the mechanics behind them.
→ See how the benefits of live chat stack up across industries.
|
Now that we know why these metrics matter, let’s talk about which ones actually deserve space on your dashboard — and what each one is really measuring.
The 6 Categories of Live Chat Metrics Every Support Leader Must Track
There are six distinct categories of metrics for live chat, and each one answers a different question about your operation.
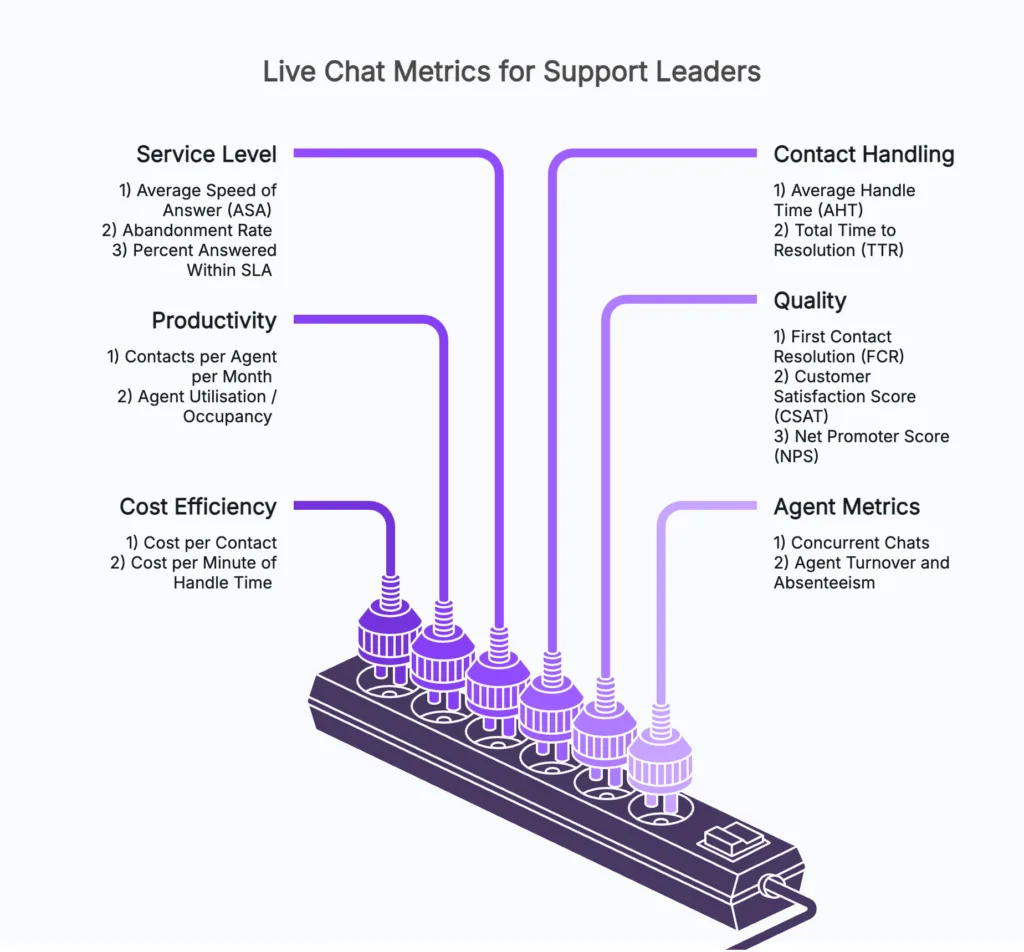
1. Cost Efficiency Metrics
The question: What does great service actually cost us?
Cost per Contact is your total support spend — wages, technology, overhead — divided by total chats handled. It’s the clearest signal of whether your live chat operation is financially sustainable. The industry average sits around $11.20 per chat contact (MetricNet), but high-performing teams consistently drive this lower through smarter staffing and AI assistance.
Cost per Minute of Handle Time goes deeper, tying your resource spend directly to how long agents engage per chat. Pair this with quality metrics and you get a complete picture of efficiency — not just speed.
→ For a breakdown of what’s hiding inside your support spend, read our guide on customer service costs.
2. Productivity Metrics
The question: Are we getting the most from our team?
Contacts per Agent per Month tracks volume handled — crucial for planning staffing and managing workloads. Industry benchmarks suggest around 600–700 chats per agent monthly. Edmunds.com’s seven-agent team handles 1,200+ chats monthly while maintaining a 93% customer satisfaction rate.
Agent Utilisation / Occupancy is the percentage of logged-in time your agents spend actively chatting versus idle. The ideal range from GlowTouch Technologies’ benchmarking research sits around 60–75% occupancy — the sweet spot between productivity and sustainability.
→ Learn how to manage agent productivity without burning your team out.
3. Service Level Metrics
The question: Are we fast enough — consistently?
Average Speed of Answer (ASA) measures how long customers wait before an agent responds. The industry standard target is 80% of chats answered within 20 seconds. Miss this regularly, and customers start abandoning.
Abandonment Rate is the percentage of customers who leave the chat before being served. Think of every abandoned chat as a customer who walked out of your store.
Percent Answered Within SLA ties your speed to a formal commitment. If you’ve promised 80% answered within 20 seconds, this metric tells you whether you’re keeping that promise.
→ Read our guide on SLA agreements and how to set realistic targets.
4. Contact Handling Metrics
The question: How efficiently are we resolving issues?
Average Handle Time (AHT) is the total chat duration plus post-chat wrap-up time. The benchmark is typically 10–15 minutes. Here’s the critical nuance: low AHT doesn’t mean good performance. An agent closing chats in 3 minutes but generating repeat contacts is costing you more, not less.
→ We’ve written an entire piece on why average handle time can be a terrible metric when used in isolation.
Total Time to Resolution (TTR) measures the full elapsed time from first contact to final problem resolution, even across multiple interactions or escalations. This is the metric that captures actual customer effort.
→ Deep dive on time to resolution and how to bring it down without sacrificing quality.
5. Quality Metrics
The question: Are we actually solving the right problems, the right way?
First Contact Resolution (FCR) is the holy grail of live chat performance metrics — the percentage of issues resolved on the very first chat. GlowTouch’s industry benchmarks put a strong FCR at around 70%. High FCR correlates directly with customer loyalty, lower costs, and reduced agent workload.
→ See our breakdown of first contact resolution and how to systematically improve it.
Customer Satisfaction Score (CSAT) is collected via post-chat surveys. Strong live chat teams average a 79.5% CSAT score (GlowTouch).
Net Promoter Score (NPS) measures the likelihood of customers referring others after chat interactions — a leading indicator of long-term loyalty, not just momentary satisfaction.
→ For a comprehensive view of customer satisfaction measurement across channels, see our full guide.
6. Agent Metrics
The question: Is our team healthy, engaged, and effective?
Concurrent Chats measures how many conversations an agent handles simultaneously. New agents: 1 at a time; experienced: 2–3; exceptional performers: up to 4 without quality loss.
→ Managing multiple simultaneous chats effectively is a skill — here’s how to develop it.
Agent Turnover and Absenteeism are often overlooked. Industry data shows annual chat agent turnover around 22.9% and daily absenteeism around 8% — both of which are disruptive leading indicators of a team under too much pressure.
Quick Benchmarks Cheat Sheet
| Metric | Benchmark | What It Signals |
| Average Speed of Answer (ASA) | < 20 seconds (80% of chats) | Queue management health |
| First Contact Resolution (FCR) | ~70% | Agent knowledge & empowerment |
| CSAT | ~79.5% | Customer experience quality |
| Average Handle Time (AHT) | 10–15 minutes | Efficiency vs. thoroughness |
| Agent Occupancy | 60–75% | Workload sustainability |
| Abandonment Rate | < 5% | Wait time & staffing adequacy |
| Concurrent Chats | 2–3 (experienced agents) | Quality-efficiency balance |
→ For a broader view of all the customer support metrics worth tracking, see our companion guide.
| Track what actually matters most
Kayako’s AI-powered dashboard gives you all of these metrics — and the intelligence to act on them — in one place. |
Knowing what to measure is only half the battle. The other half is measuring it correctly. Let’s talk about where most teams quietly get their numbers wrong — and what it costs them.
How to Measure Response and Resolution Times the Right Way
Here’s a confession most reporting frameworks won’t make: bad measurement is worse than no measurement. If your ASA data is calculated incorrectly, you might be congratulating yourself on 15-second response times that are actually 3 minutes for half your customers.
Average Speed of Answer (ASA): Start the Clock at the Right Moment
ASA is the average time a customer waits in your chat queue until an agent picks up. Sounds simple. It isn’t.
Four rules that most teams violate:
- Start from queue entry, not message send. The clock starts the moment a customer enters the queue — not when they type their first message. Clarity here alone can shift your reported ASA by minutes.
- Exclude off-hours. If your chat is staffed 9am–6pm, don’t include overnight queued chats in your ASA. It distorts the number and masks real staffing gaps.
- Count only the first agent response. ASA measures speed to first contact, not the cadence of the full conversation.
- Separate bot responses from human responses. If a chatbot handles first contact, track bot and human response times as distinct metrics.
→ For more on optimising live chat first response time and what good looks like at scale, see our dedicated breakdown.
Abandonment Rate: The Silent Revenue Killer
Abandonment Rate = chats started but not completed ÷ total chats started × 100%.
A high abandonment rate is a red flag — usually pointing to long wait times, understaffing, or a frustrating UX. Don’t react to daily spikes; look at weekly and monthly trends. The root cause is almost always one of three things: not enough agents, wrong scheduling, or a queue management process that doesn’t match your traffic patterns.
First Response Time vs. Total Time to Resolution: Know the Difference
First Response Time measures how quickly a customer gets a human response. It shapes first impressions deeply.
Total Time to Resolution (TTR) measures the full journey from first contact to complete resolution — including reopened tickets, escalations, and follow-up interactions. TTR captures actual customer effort and true operational efficiency.
| “96% of customers who experience a high-effort interaction become disloyal to that company, compared to only 9% who have a low-effort experience.”
— Harvard Business Review, “Stop Trying to Delight Your Customers” |
→ For a detailed framework on live chat handle time and how to interpret it in context, see our guide.
→ Also worth reading: our live chat best practices guide — includes measurement frameworks for teams at every scale.
Accurate measurement is the foundation. But data only becomes valuable when you apply it to the people delivering your service. Next: how to use live chat performance metrics to evaluate — and improve — your agents.
Evaluating Agent Performance Through Live Chat Metrics
Your agents are the frontline of your brand. Evaluating them well means using the right metrics — and using them fairly. Here’s how to build an agent evaluation framework that’s both rigorous and human.
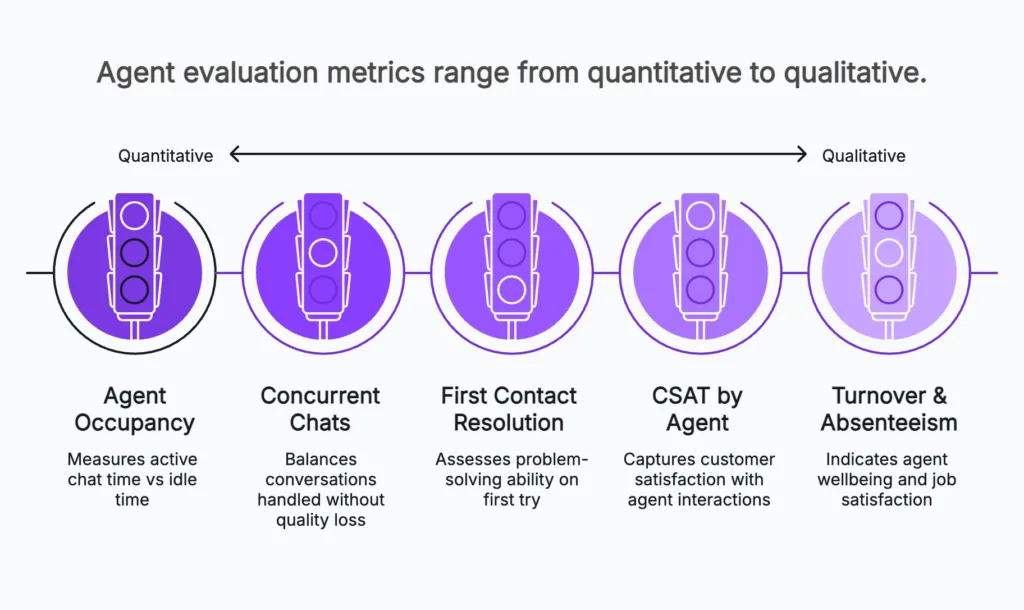
Agent Occupancy: The Goldilocks Metric
Occupancy measures the share of logged-in time an agent spends actively chatting versus idle. Too low (below 60%) and you’re paying for capacity you’re not using. Too high (above 85%) and you’re burning people out, slowing responses, and quietly destroying satisfaction scores.
GlowTouch’s industry research notes an industry sweet spot around 73% occupancy — productive enough to justify headcount, sustainable enough to maintain quality. Not too hot, not too cold.
Concurrent Chats: The Efficiency Balancing Act
How many conversations can one agent genuinely handle without degrading quality?
- New agents: 1 chat at a time — learning curves are real, and mistakes at the start are expensive
- Experienced agents: 2–3 simultaneously — the productive sweet spot for most operations
- Top performers: Up to 4 — but this requires strong knowledge bases, fast typing, and a low-complexity product
→ See our guide on managing multiple chats simultaneously and how to develop concurrency skills in your team.
First Contact Resolution (FCR) by Agent: Your Most Powerful Coaching Tool
Individual FCR rates reveal something no survey or peer review can: whether your agents actually understand your product and processes deeply enough to solve problems the first time.
An agent consistently scoring below 50% FCR might have knowledge gaps, be handling the wrong ticket types, or be missing authority to resolve issues. Use FCR by agent to identify coaching needs, not to punish performance.
CSAT by Agent: The Voice of the Customer, Personalised
Post-chat CSAT surveys per agent reveal communication style, empathy, and resolution quality in ways that pure metrics can’t capture. Use them to spot stars — and to design targeted coaching for those who need it.
Don’t Ignore Human Metrics: Turnover and Absenteeism
High agent turnover (industry average around 22.9% annually) and daily absenteeism (approximately 8% on any given day) are not just HR problems — they’re customer experience problems. Every new agent comes with a quality dip during onboarding.
|
If occupancy is spiking and absenteeism is rising at the same time, you don’t have a lazy team — you have a structural staffing problem.
→ For strategies to maintain agent productivity while protecting team wellbeing, our guide covers both sides.
|
Solid agent metrics are the engine. But the real destination is customer satisfaction and business growth. Here’s how to take everything we’ve covered and turn it into outcomes that matter to your bottom line.
Using Live Chat Metrics to Drive Customer Satisfaction and Business Growth
Numbers alone are meh. It’s what you do with them that powers change. Live chat performance metrics are your GPS and fuel gauge simultaneously — they tell you where you are and whether you’re going to make it to your destination.
The Satisfaction-Speed Paradox (And How to Resolve It)
Teams that chase low AHT without tracking FCR often find they’ve solved for the wrong outcome: they’re closing chats faster, but customers are reopening tickets at higher rates. The result? More contacts, not fewer. Higher costs, not lower.
The resolution is to balance your speed metrics against your quality metrics. A higher FCR rate of 70%+ will always deliver more business value than a low AHT alone. According to Harvard Business Review’s research on customer effort, reducing effort — not just increasing speed — is the primary driver of loyalty.
→ Measure Customer Effort Score (CES) alongside CSAT and NPS for a complete satisfaction picture.
Metrics That Unlock Revenue Growth
- Cut cart abandonment: Proactively engage customers hesitating at checkout. Studies find live chat can boost conversion rates by over 20% when deployed proactively (Forrester Research).
- Enable cross-selling and upselling: Track post-chat purchase rates and train agents to replicate patterns that correlate with revenue.
- Reduce headcount pressure: Optimise agent occupancy and concurrency so you handle more volume without adding staff. GlowTouch clients report up to 250% ROI by aligning cost and quality metrics intelligently.
- Scale intelligently around surges: Benchmark your team size against historical traffic patterns to plan for campaigns and seasonal spikes before they hit.
| McKinsey Research: AI-enabled customer service can reduce service costs by up to 30% while simultaneously improving customer satisfaction — but only when implemented against the right performance baselines. |
Personalisation: The Metric Multiplier
Use customer data — location, purchase history, previous interactions — to trigger tailored chat conversations. Personalised proactive chat outperforms reactive chat on every metric. But you only know it’s working if you’re measuring it.
→ See how live chat customer satisfaction strategies work in practice, with real-world examples and benchmarks.
→ Also explore our guide on customer experience metrics to build the full measurement stack.
Knowing what to track and how to use it is now solid. But which platform you use to measure, automate, and act on these metrics makes all the difference. Here’s where Kayako comes in.
How Kayako Helps You Turn Live Chat Performance Metrics Into Real Results
Most support platforms give you data. Kayako gives you clarity — and action.
Kayako is an AI Support Agent and Modern Help Desk platform built specifically for support leaders who need to scale their operations without proportionally scaling their headcount. And it’s implemented by Kayako’s own professional services team — not left to you to figure out alone.
Real-Time Dashboards That Tell You What Actually Matters
Kayako’s KPI dashboard surfaces the live chat performance metrics that drive outcomes — CSAT, Average Response Time, First-Touch Resolution — in real time, without the noise of vanity metrics cluttering your view. Your agents can see their own performance. Your managers can see team trends. You can see the business impact.
AI Agents That Improve Your Metrics Without Adding Headcount
Here’s the thing about scaling live chat: the traditional playbook is “add more agents.” More agents means more cost, more training time, more management overhead, and more variability in customer experience.
Kayako’s AI Agents handle the repetitive, high-volume queries — freeing your human team for the complex, high-value conversations that require genuine empathy and expertise. The result:
- Lower ASA across the board — AI responds instantly
- Higher FCR — AI resolves common issues without escalation
- Better agent occupancy — your team handles fewer easy tickets and more meaningful ones
- Lower cost per contact — without cutting corners on quality
|
Expert Implementation: 90-Day Pilot, Clear ROI
Most AI deployments fail not because the technology is bad — but because implementation is bad. Gartner and MIT research shows 95% of enterprise AI deployments fail. The difference with Kayako is that you’re not doing it alone.
Kayako’s 90-Day AI Agent Pilot approach:
- Pick one support queue — not your whole operation. Start focused, prove results.
- Expert implementation by Kayako’s Professional Services team — built on hundreds of successful deployments, not guesswork.
- Clear KPIs from day one — CSAT, Average Response Time, and First-Touch Resolution tracked from the moment you go live.
- Measurable ROI in 90 days — or you know exactly why not and what to fix.
|
|
Frequently Asked Questions About Live Chat Metrics
1. What are live chat performance metrics?
A. Live chat performance metrics are quantitative measurements used to evaluate how effectively, efficiently, and consistently your live chat support operation delivers results. They cover speed (ASA, first response time), quality (FCR, CSAT), cost (cost per contact), and agent health (occupancy, concurrency, turnover). Together, they give you a complete operational picture.
2. Which live chat metrics should I prioritise first?
A. Start with the big three: Average Speed of Answer (ASA) to understand wait times, First Contact Resolution (FCR) to gauge whether you’re actually solving problems, and CSAT to hear directly from customers. Once these are stable, layer in productivity metrics like occupancy and concurrent chats.
3. What is a good average handle time (AHT) for live chat?
A. Industry benchmarks typically place AHT at 10–15 minutes, but this varies significantly by industry and complexity. More importantly: AHT should never be evaluated in isolation. An agent with a 5-minute AHT but 45% FCR is costing you more than one with a 14-minute AHT and 78% FCR. Context is everything.
→ See why we think AHT can be a misleading metric on its own.
4. How many concurrent chats can one agent handle?
A. New agents: 1 at a time. Experienced agents: 2–3. Top performers: up to 4. Overloading agents beyond their effective concurrency level doesn’t save money — it costs you in quality, repeat contacts, and eventual burnout. Build concurrency limits into your routing logic, not just your guidelines.
5. How can I reduce chat abandonment rate?
A. The most effective levers are: aligning staffing with traffic peaks to reduce ASA, using proactive chat invitations to keep customers engaged while they wait, and communicating estimated wait times clearly in the chat window. High abandonment is almost always a staffing or routing problem — not a customer behaviour problem.
6. How does live chat satisfaction compare to other support channels?
A. Live chat consistently outperforms phone and email on satisfaction. HubSpot’s State of Service puts live chat customer satisfaction at 73% — the highest of any support channel — thanks to its immediacy, the ability to multitask, and the permanency of the transcript.
7. How do I calculate cost per contact for live chat?
A. Add all direct and indirect support costs — agent salaries, benefits, software subscriptions, management overhead — and divide by total chat contacts handled in that period. This gives you your true cost basis per interaction, the number you’ll want to benchmark against industry averages and track over time as you optimise.
8. Should I measure satisfaction immediately after chat?
A. Yes — timing matters enormously for CSAT accuracy. Survey immediately post-chat for the highest response rates and most accurate emotional recall. Keep surveys short (one to two questions) and rotate between CSAT, NPS, and open-ended feedback to avoid survey fatigue.
The Bottom Line: Your Live Chat Metrics Are a Growth Strategy, Not a Report Card
Live chat metrics aren’t about measuring the past. They’re about shaping the future.
When you track the right live chat performance metrics — ASA, FCR, CSAT, AHT, occupancy, TTR — you don’t just see what happened in last week’s chats. You see where your operation is leaking revenue, burning out your best agents, and frustrating customers who were one good interaction away from becoming loyal advocates.
And when you act on those metrics — building smarter workflows, coaching agents on the data that matters, deploying AI to absorb volume without sacrificing quality — you transform chat from “just support” into a genuine strategic advantage.
The best strategy? Balance speed with quality. Balance cost with satisfaction. Balance agent load with human sustainability. Naively chasing one at the expense of another is how you end up with fast responses that solve nothing, or low costs that drive customers straight to your competitors.
Metrics-driven operations win. Not because data is magic — but because the teams who understand their numbers make better decisions, faster, with more confidence.
The question is: are you one of them?
|